Your auto insurance renewal notice arrived and the number made you pause. You are not alone. Between September 2020 and September 2025, the Bureau of Labor Statistics recorded a 64 percent increase in motor vehicle insurance costs, a rise that outpaced general consumer price inflation by more than two to one. In 2026, the pace of increase has modestly eased for standard-risk drivers, but premiums remain near historic highs and continue climbing for higher-risk profiles.
Understanding why this is happening is not just academic. Knowing which causes you can influence and which you cannot determines where your energy is best spent. This guide covers the structural causes in depth, identifies who is bearing the heaviest burden in 2026, describes what the current market looks like, and delivers a comprehensive toolkit of strategies that can realistically save you hundreds to thousands of dollars annually.
In This Article
- The 6 Structural Causes of Rising Auto Insurance Rates
- Who Is Getting Hit Hardest in 2026
- The 2026 Market: Where Rates Stand Now
- 11 Proven Strategies to Lower Your Premium
- How to Shop Auto Insurance Effectively
- Discounts Most Drivers Never Claim
- Right-Sizing Your Coverage
- Outlook for the Rest of 2026
The 6 Structural Causes Driving Auto Insurance Rates Higher
There is no single villain. Six overlapping structural forces have converged to push insurance costs to levels that would have seemed implausible just five years ago. Each compounds the others, and none is resolving quickly.
1. Vehicle Repair Costs Have Exploded
Modern vehicles are engineering marvels stuffed with sensors, cameras, radar arrays, advanced driver assistance systems, and specialty materials including aluminum and high-strength steel. A rear bumper replacement on a 2024 sedan equipped with a parking sensor, backup camera, and cross-traffic alert system costs $2,800 to $4,500. The identical repair on a 2012 model costs $400 to $700. The difference is the cost of recalibrating every sensor and camera embedded in that bumper after the physical repair is complete, plus premium original-equipment parts.
Windshields illustrate the same dynamic. A front windshield on an older vehicle without driver-assistance cameras costs $180 to $350 to replace. On a 2024 or 2025 vehicle with a forward-facing camera for automatic emergency braking, replacement costs $900 to $1,600 because the camera requires professional recalibration after installation using specialized diagnostic equipment. An uncalibrated safety camera can fail to activate at a critical moment or generate dangerous false alerts.
Repair shop technician wages have risen significantly alongside general wage inflation. Specialized ADAS-capable technicians command premium compensation. The pool of certified shops with credentials to service the most technologically complex vehicles remains smaller than demand requires in many markets, providing additional pricing power to those certified shops. Every one of these factors flows directly into claim payouts and from there into your renewal premium.
2. Import Tariffs Are Adding a New Cost Layer
The tariff environment that took shape in 2025 and carried into 2026 introduced a new cost variable that auto insurers were not pricing for when they set current rate structures. Many vehicle components including body panels, electronic control modules, specialty glass, and fasteners are sourced from Canada, Mexico, South Korea, Japan, and Germany. Tariffs on automotive goods from these countries have flowed into repair invoices within months.
Industry analysts project tariff-related cost increases could add 3 to 8 percent to average claim costs by the end of 2026, layered on top of the already elevated repair cost baseline. Several major carriers have flagged tariff uncertainty as a reason they may file additional rate increases in the second half of 2026 even where current combined ratios are satisfactory.
3. Medical Costs from Accidents Keep Climbing
When an at-fault driver injures someone, their bodily injury liability coverage pays for the injured party's medical treatment, rehabilitation, and related costs. Medical costs in the United States have risen 6 to 8 percent annually for more than a decade, consistently outpacing general inflation. More expensive hospital stays, surgical procedures, physical therapy courses, and pharmaceuticals all mean that bodily injury liability claims cost insurers more every year regardless of whether accident frequency changes.
High-litigation-environment states amplify this dynamic. Personal injury attorneys in these markets build up medical billing as part of the claims process. Florida and Louisiana have historically been the most extreme examples, though tort reform in both states has moderated the worst practices over a multi-year timeline. Legal defense costs and extended settlement timelines are baked into premium pricing market-wide.
4. Vehicle Theft Rates Remain Elevated
The Hyundai and Kia keyless ignition vulnerability exposed virally in 2021 and 2022 produced a multi-year theft wave affecting hundreds of thousands of vehicles. Software patches have reduced but not eliminated the elevated theft profile for those brands. Full-size pickup trucks from Ford, Chevrolet, GMC, and RAM remain among the most stolen nationally because their high parts resale value makes them attractive targets. Catalytic converter theft, while reduced from peak levels, continues generating comprehensive claims in most markets.
Higher theft claims in your geographic area raise comprehensive coverage costs for every driver in that rating territory, even those whose specific vehicles carry no unusual theft risk. The pooled-risk structure of insurance means your premium reflects the claims experience of your entire rating market.
5. Severe Weather Is Generating Record Claim Volumes
NOAA recorded 27 separate billion-dollar weather events in 2024. Major hailstorms across the Great Plains total thousands of vehicles in a single overnight storm system. Hurricane landfalls flood and destroy tens of thousands of cars along affected coastlines. Wildfires in the Western states periodically destroy entire neighborhoods of vehicles alongside homes. Flooding events that historically occurred once every 50 years are now recurring with increasing frequency in areas not previously considered flood-exposed.
Insurers spread catastrophic losses across their entire book of business through reinsurance and cross-market pricing. A driver in Kansas whose car is never near a hurricane still pays higher comprehensive premiums because that coverage pools risk nationally. As weather severity increases, actuarial models ratchet upward to maintain insurer solvency.
6. Insurers Are Recovering From Years of Underpricing
During 2020 and 2021, pandemic-reduced traffic suppressed claims frequency sharply, and several major carriers held rates flat or reduced them to retain customers. When traffic normalized in 2022 and inflation drove claim costs higher, insurers found themselves dramatically underpriced. Combined ratios at most major carriers turned deeply unprofitable for two to three consecutive years.
The aggressive rate increases of 2022 through 2024 were this catch-up dynamic playing out market-wide. Most carriers have now restored profitability, contributing to the moderating rate environment for favorable segments in 2026. But base rates are anchored at a permanently higher level than pre-pandemic benchmarks, and any additional cost pressure gets layered on top rather than absorbing into excess profitability.
Auto Insurance Rate Snapshot: 2026
Who Is Getting Hit Hardest in 2026
High-Risk Drivers Face Steep Ongoing Increases
Drivers with a DUI in the past three to five years, multiple at-fault accidents, serious violations like reckless driving, or substantially impaired credit continue experiencing meaningful premium increases. A single DUI can raise premiums 80 to 150 percent at most carriers and may result in non-renewal or difficulty finding standard market coverage entirely.
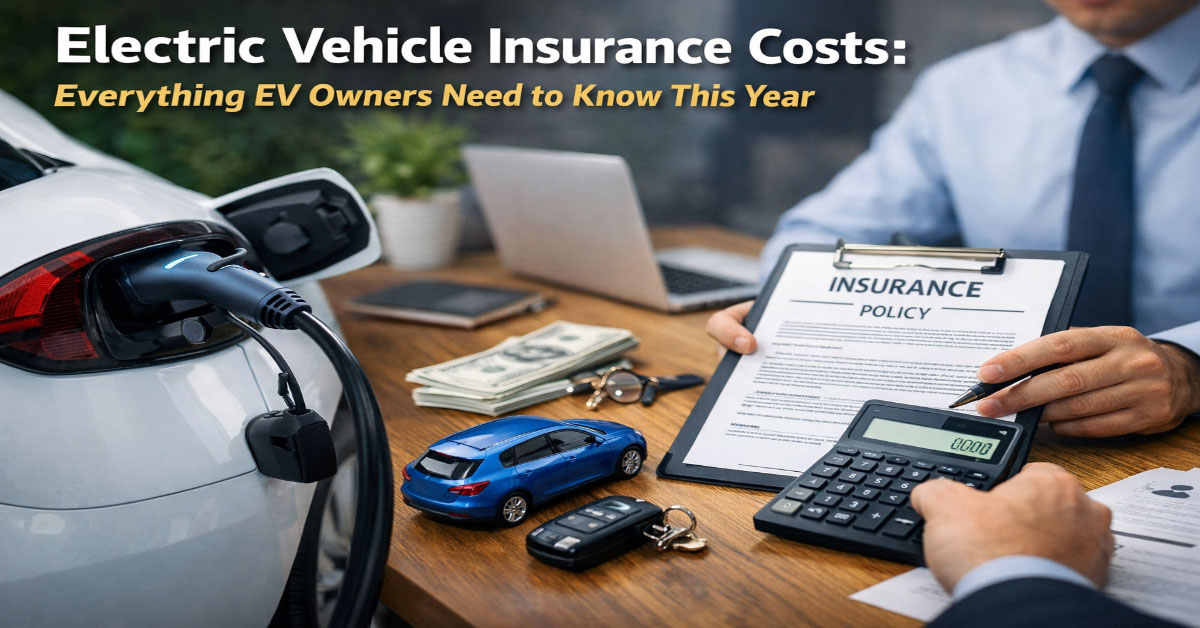
Electric Vehicle Owners
EV owners pay an average of 18 to 49 percent more annually. Battery replacement costs of $4,000 to $20,000, expensive electronics, limited repair networks, and higher per-claim costs drive this premium. The gap is narrowing as the EV repair ecosystem matures but remains substantial in 2026.
Younger Drivers, Particularly Teens
Teen and young adult drivers face the highest statistical crash rates and highest base premiums. For families adding a teen driver, annual premium increases of $1,500 to $3,000 are common depending on vehicle type and location.
High-Risk Geographic Areas
Location is one of the most powerful pricing factors. High-crime urban ZIP codes, coastal flood and hurricane exposure, high-litigation states, and dense traffic all drive above-average premiums. Even moving a few miles from a high-risk to a lower-risk ZIP code can produce premium reductions exceeding any other single action available to an individual driver.
Standard Clean-Record Drivers: More Competition in 2026
Drivers with clean records, good credit, and modern-safety-rated vehicles are experiencing a more competitive market in 2026. Carriers that overshot on rate increases are now competing for this segment. Drivers who have not shopped coverage in the past two years are almost certainly overpaying.
The 2026 Market: Where Things Stand
Insurify's 2026 data shows national average rate change moderating to approximately plus one percent year-over-year after a prior-year decline of roughly six percent, dramatically more benign than the 20-plus percent increases of 2022 and 2023. But averages obscure enormous variation. Carriers that over-corrected rates are now competing aggressively for standard-risk customers. Carriers with above-average loss ratios in specific states continue selective increases.
Tariff uncertainty is the most significant new variable. Carriers cannot fully price tariff-driven cost increases until they accumulate actual claims data reflecting those costs, creating a 6 to 12 month lag. Drivers who shop aggressively now and lock in favorable rates reduce their exposure to midyear or next-cycle increases driven by tariff cost pass-through.
11 Proven Strategies to Lower Your Auto Insurance Premium
Strategy 1: Shop Every Renewal Without Exception
Rate variation between carriers for identical driver profiles routinely exceeds $1,000 and can approach $1,500 to $2,000 annually. Each carrier's pricing is driven by its own actuarial models, reinsurance costs, geographic book-of-business concentration, and competitive objectives. These factors shift continuously. There is no loyalty dividend in auto insurance that approaches the savings from active shopping. Thirty minutes of annual comparison work is among the highest-return financial activities available to most households.
Strategy 2: Use an Independent Insurance Broker
An independent broker represents multiple carriers and efficiently shops your profile across dozens of markets simultaneously, including regional and specialty carriers that do not appear in standard comparison tools. For drivers with non-standard profiles, unusual vehicles, or complex coverage needs, an independent broker's access to specialty and regional markets can uncover options that direct-channel shopping misses entirely. The broker earns a commission from the carrier, making this a zero additional cost service to the driver.
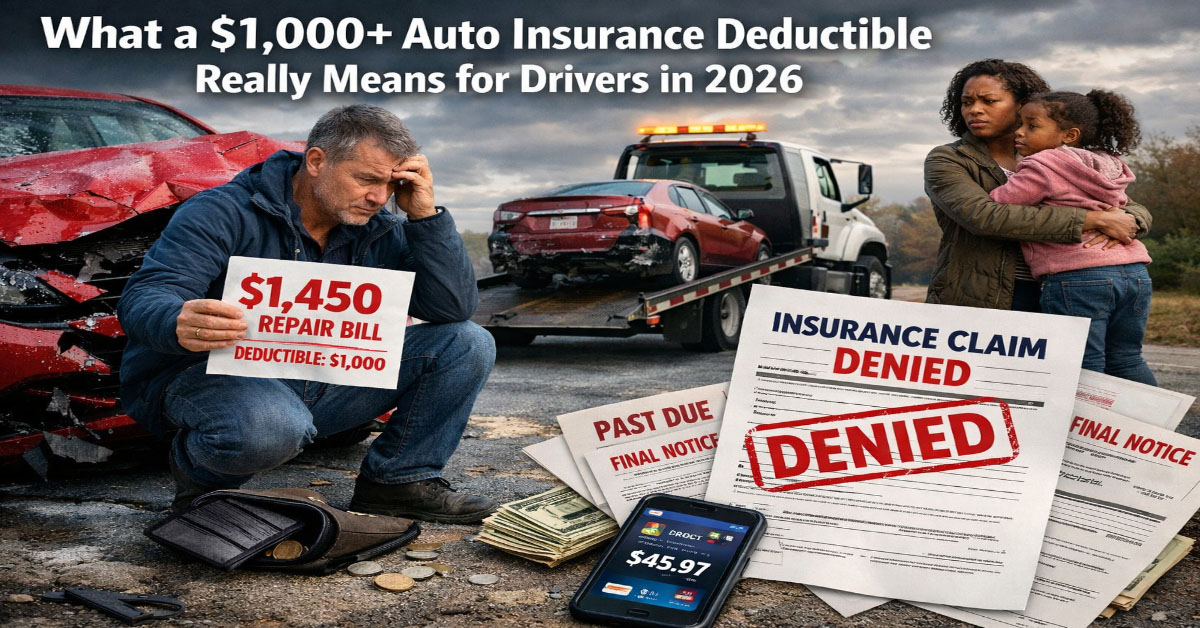
Strategy 3: Raise Your Deductible Strategically
Increasing collision and comprehensive deductibles from $500 to $1,000 typically reduces those coverage premiums by 10 to 15 percent. If the change saves $200 per year and adds $500 in per-claim exposure, the break-even is 2.5 years between claims. The average driver files roughly one collision claim every seven to ten years. Over any meaningful time horizon, the higher deductible almost always saves money for drivers who have accessible savings to cover it. Never raise your deductible above what you could genuinely pay without financial hardship.
Strategy 4: Bundle Home and Auto Insurance
Placing homeowners or renters insurance with the same carrier as your auto policy generates a multi-policy discount typically running 5 to 25 percent. On a combined $5,000 home and auto premium, a 15 percent bundle discount saves $750 annually. Revisit the bundle math annually to ensure the discount outweighs any pricing advantage from separate best-in-class carriers for each coverage type.
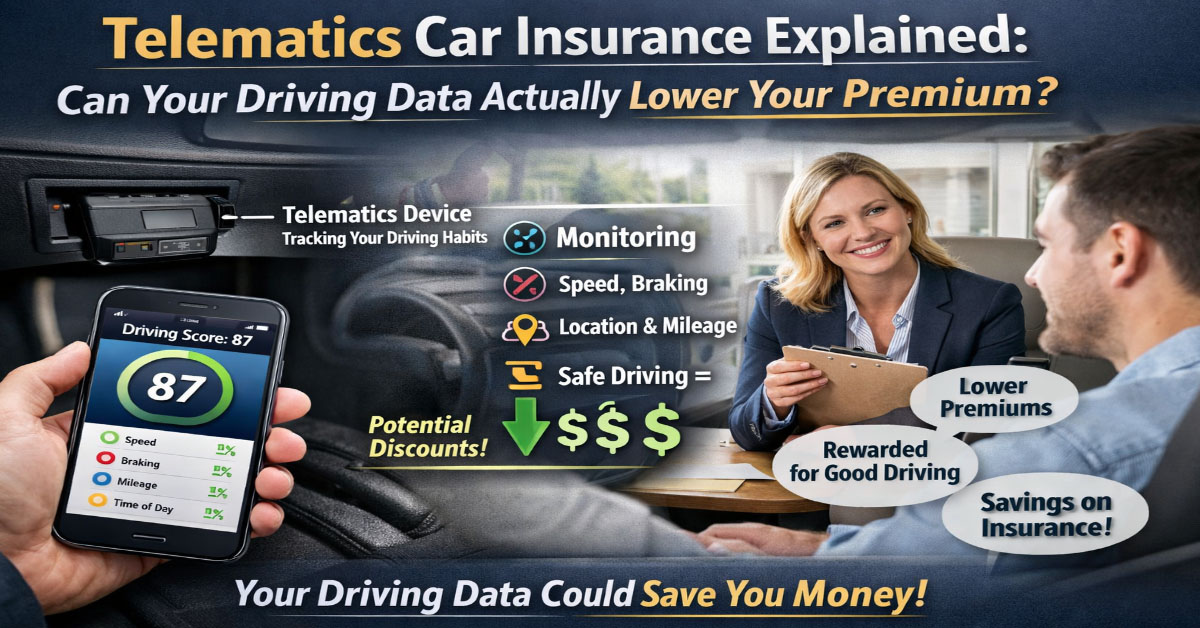
Strategy 5: Enroll in a Telematics Program If Your Profile Qualifies
Usage-based insurance programs reward safe, low-mileage, daytime drivers with discounts of 15 to 30 percent. Programs like State Farm Drive Safe and Save and Liberty Mutual RightTrack cannot raise rates based on driving data, making them risk-free options for qualifying drivers. Progressive Snapshot can raise rates for risky drivers, so only enroll if you are confident your driving data will be favorable. Night-shift workers and urban drivers with frequent unavoidable hard braking are typically better served by other savings strategies.
Strategy 6: Ask Explicitly for Every Available Discount
Insurance discounts are not always automatically applied. Ask your carrier to run through their complete discount catalog. Good student, defensive driving course completion, professional association membership, employer group, paperless billing, autopay, paid-in-full annual premium, anti-theft device, garage parking, and new vehicle safety technology discounts are all worth asking about specifically. A combination of these can reduce premiums by $150 to $400 annually.
Strategy 7: Improve Your Credit Score
In most states, insurers use a credit-based insurance score correlated with your consumer credit. Moving from fair to good credit can reduce auto premiums by 20 to 40 percent at many carriers. Paying all bills on time, reducing revolving utilization below 30 percent, and disputing credit report errors are the most impactful steps. These improvements compound benefits across multiple financial products simultaneously.
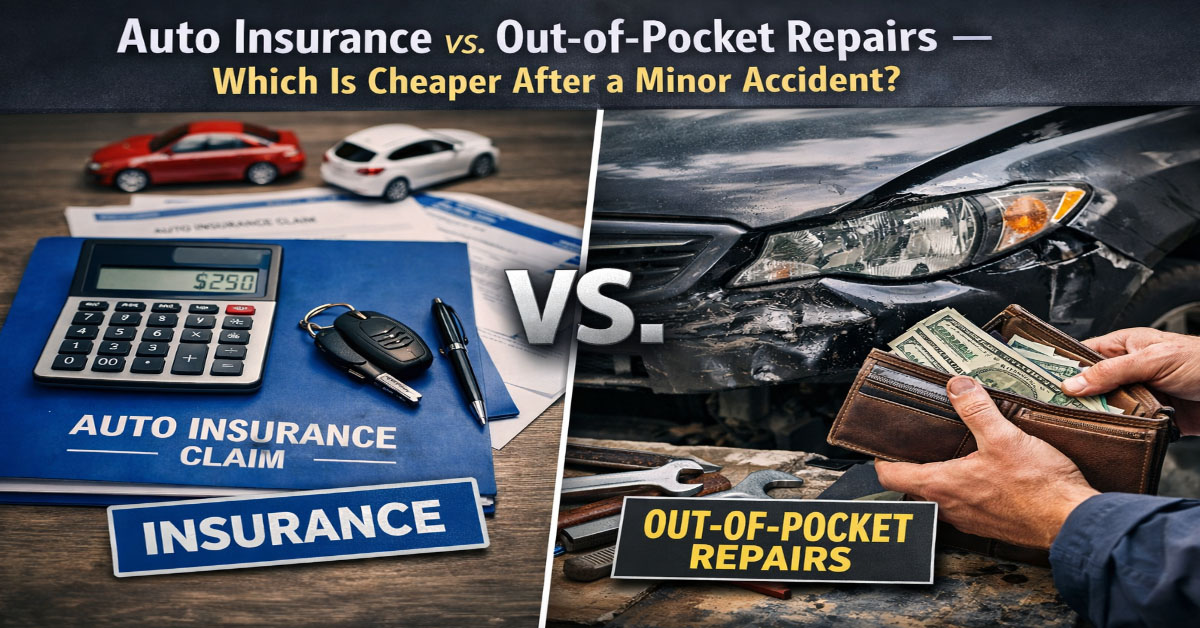
Strategy 8: Reassess Coverage on Older Vehicles
Collision and comprehensive coverage becomes economically questionable when the combined annual premium exceeds 10 percent of the vehicle's current market value. A $4,500 vehicle with $550 per year in collision and comprehensive premiums provides a maximum $4,000 net payout in a total loss. After several years of $550 annual payments, self-insuring through savings is often rational. Check Kelley Blue Book value at each renewal as your vehicle ages.
Strategy 9: Consider Pay-Per-Mile Insurance
If you drive significantly fewer than the national average of approximately 13,500 miles annually, pay-per-mile programs like Nationwide SmartMiles can produce substantial savings. A base monthly rate plus a per-mile fee benefits remote workers, retirees, and urban residents who drive fewer than 7,000 to 8,000 miles per year. Annual costs under $1,000 for full coverage are achievable at very low mileage levels.
Strategy 10: Factor Insurance Cost Into Vehicle Purchases
Before purchasing a vehicle, obtain insurance quotes for the specific year, make, model, and trim. Two vehicles with nearly identical sticker prices can differ by $400 to $800 per year in insurance cost based on repair profile, safety rating, theft frequency, and injury claim severity. This 15-minute exercise can reveal meaningful total cost of ownership differences that sticker price alone does not capture.
Strategy 11: Correct Your Annual Mileage Estimate
If your driving has changed due to a job change, relocation, or remote work shift, your annual mileage estimate on file with your insurer may significantly overstate your actual driving. Contact your insurer to update this figure. Most carriers factor mileage into pricing, and correcting an overstated estimate can produce an immediate premium reduction at your next renewal.
How to Shop Auto Insurance Effectively
Start by pulling your current declarations page and noting every coverage type, limit, and deductible in force. These are your comparison baseline. Every competing quote should use identical parameters so you compare equivalent protection rather than a cheaper quote that reflects lower limits or a higher deductible. Get at least five quotes: your current insurer, two to three major nationals, and at least one regional carrier. Regional carriers like Erie Insurance, Auto-Owners, Amica Mutual, and Farm Bureau companies consistently rank highest in customer satisfaction and frequently match or beat national carriers on price in their operating territories.
Discounts Most Drivers Never Claim
The affinity discount rewards members of professional associations, alumni networks, credit unions, and employer groups with 5 to 15 percent discounts at participating carriers. USAA offers exceptional rates to military members and veterans. The new vehicle safety technology discount applies to vehicles with automatic emergency braking, lane departure warning, blind spot monitoring, and adaptive cruise control. The garage parking discount is small but consistently available for vehicles stored in enclosed garages overnight.
Right-Sizing Your Coverage
State minimum liability limits are universally inadequate for the actual financial exposure a serious accident creates. Any driver with assets worth protecting should carry at least $100,000 per person and $300,000 per occurrence in bodily injury liability. An umbrella policy extending to $1,000,000 costs only $150 to $300 annually and is among the most cost-efficient financial protections available to middle-income families. Uninsured motorist coverage protects you when the driver who injures you carries no insurance. One in eight American drivers carries no auto insurance at all. Gap coverage for financed vehicles protects when your loan balance exceeds the vehicle's actual cash value after a total loss.
The Outlook for the Rest of 2026 and Beyond
The structural forces driving auto insurance costs are not disappearing. Tariff uncertainty adds a new cost variable not yet fully priced. Severe weather continues generating periodic catastrophic claim spikes. Repair costs for technology-dense modern vehicles remain elevated. Medical cost inflation is a multi-decade trend that auto insurance absorbs continuously through bodily injury liability claims.
The most realistic expectation is continued segmentation: favorable pricing competition for clean-record standard drivers and continued above-average increases for high-risk profiles, EV owners, and drivers in catastrophe-exposed markets. Drivers who pay the least are those who shop actively at every renewal, use behavioral discount programs strategically, maintain clean driving records and strong credit scores, and make every coverage decision based on rational analysis of actual financial exposure rather than habit.
Understanding Your Auto Insurance Declarations Page
Your declarations page, commonly called the dec page, is the single most important document in your auto insurance relationship. It is a one or two page summary of everything your policy covers: the covered vehicles, all named drivers, each coverage type, the limit for that coverage, the deductible, the premium for that coverage, and the total annual premium. Knowing how to read your declarations page is the foundation of any intelligent insurance management decision.
The coverage section lists each coverage type separately: bodily injury liability, property damage liability, medical payments or personal injury protection, uninsured motorist, underinsured motorist, collision, comprehensive, and any endorsements you have added. Each coverage has a premium associated with it. By examining these individually, you can identify which coverages are consuming the largest share of your premium and evaluate whether adjusting them would make sense for your situation.
The limits section shows the maximum the insurer will pay for each coverage category. Bodily injury limits are expressed as a per-person and per-occurrence pair, such as $100,000 per person and $300,000 per occurrence. This means the insurer will pay up to $100,000 for any single injured person and up to $300,000 total for all injured parties from a single accident. Understanding these limits and whether they are adequate for your asset level is one of the most important evaluations you can perform on your current policy.
When you compare quotes from competing carriers, you are comparing their pricing for identical declarations page specifications. Any quote with different limits, deductibles, or coverage inclusions is not a meaningful comparison regardless of how the headline number looks. The discipline of quoting on identical specifications is what separates productive insurance shopping from the experience of switching to a cheaper policy only to discover the coverage gap when a claim occurs.
How Accident Forgiveness Programs Work
Accident forgiveness is an endorsement or program feature offered by many major carriers that waives the premium surcharge for a first at-fault accident within a defined eligibility window. The programs vary significantly between carriers in terms of eligibility requirements, how the forgiveness is earned or purchased, and exactly what is forgiven.
Some carriers include accident forgiveness automatically after three to five years of continuous claim-free coverage with that carrier. Others offer it as a purchasable endorsement add-on. Some programs forgive only the first at-fault accident regardless of severity. Others have damage amount thresholds above which forgiveness does not apply. Understanding the specific terms of your carrier's program before you need it is valuable because the program that sounds like unconditional protection may have conditions that exclude the specific scenario you encounter.
The financial value of accident forgiveness depends on your carrier's standard at-fault surcharge rate and your current premium. If your carrier applies a 35 percent surcharge for three years on a $2,200 annual premium, a single forgiven at-fault accident saves $2,310 in cumulative surcharge costs. The endorsement typically costs $50 to $150 annually. At those numbers, accident forgiveness pays for itself if you have even one at-fault accident during your policy period, making it worth considering particularly for drivers who commute in high-traffic areas or whose household includes younger drivers with statistically higher accident frequencies.
Insurance coverage decisions benefit from regular review because both your circumstances and the insurance market change continuously. Setting a calendar reminder to review your coverage at least 30 days before each renewal gives you time to compare quotes, evaluate coverage changes, and make adjustments based on changes in your financial situation, family structure, or risk exposure. The most effective insurance strategy is not a one-time decision but an ongoing process of alignment between your coverage structure and your actual needs and financial capabilities.